Makro
-
Market update 20.november.2014.
This update goes through most of the Asset classes and a lot of Charts.
We could have an interesting set up in the Currency marked but more on that later in the update.
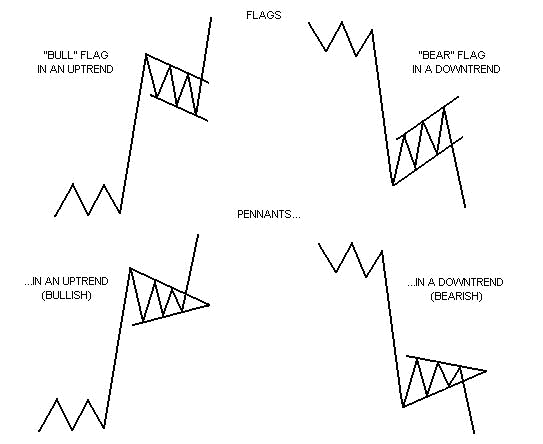
Patterns of interest in this update.
http://www.chartpatterns.com/images/2flgpnts.gifStock / bond Ratio - when to be placed in Stocks vs. Bonds.
http://stockcharts.com/h-sc/ui?s=$SPX:$UST&p=W&b=5&g=0&id=p60526537510&a=258204171&r=1416772731835&cmd=printIn alphabetical order we will start with Agriculturals.
On the monthly chart of the Agricultural Index - Spot Price we had a top in 2011 and prices has been in downtrend since.
In October this year we hit the bottom of the channel and we now see some bounce upwards.
http://stockcharts.com/h-sc/ui?s=$GKX&p=M&b=5&g=0&id=p24788608551&a=248806248&r=1415991400068&cmd=printLivestock Index - Spot Price is in uptrend and it is accelerating. We could see a Top in 2015 - 2016.
http://stockcharts.com/h-sc/ui?s=$GVX&p=M&b=5&g=0&id=p36240649770&a=248806245&r=1415991757504&cmd=printCycle in Soybeans hit bottom in October. But uptrend will only last a few months.
http://stockcharts.com/h-sc/ui?s=$DJASY&p=W&b=5&g=0&id=p57934504075&a=265779043&r=1415992222494&cmd=printBonds.
A Few Charts on Bonds and Yield.
First we will have a chart on 10 Year Treasure Yield. Do we have a possible Bull-flag here ?
This rise in 10 Year Yield is close related to the final rise in Lagging Indicator before next recession.
http://stockcharts.com/h-sc/ui?s=$TNX&p=M&b=5&g=0&id=p23524608570&a=222796989&r=1415992951120&cmd=printCycle in 30 Year bond Price.
http://stockcharts.com/h-sc/ui?s=$USB&p=M&yr=20&mn=11&dy=30&id=p53263513541&a=235025241&r=1415993235921&cmd=print30 Year bond Yield.
http://stockcharts.com/h-sc/ui?s=$TYX&p=M&st=1986-01-13&en=today&id=p46376255242&a=331626627&r=1415994359396&cmd=print2, 5, 10 and 30 Year Yield.
http://stockcharts.com/h-sc/ui?s=$UST30Y&p=D&yr=3&mn=0&dy=0&id=p38215461435&a=334964783&r=1415994786497&cmd=printSome Commodity Charts.
Reuters CRB (CCI) finally broke Fibonacci support and are heading south.
http://stockcharts.com/h-sc/ui?s=$CCI&p=M&b=5&g=0&id=p88275313805&a=270378628&r=1415995309152&cmd=printCRB-Commodity Index with sHs - pattern and Martin Prings Inflation Index turning South.
http://stockcharts.com/h-sc/ui?s=!PRII&p=M&yr=20&mn=0&dy=0&id=p10606342747&a=369860779&r=1413148675010&cmd=printCrude Oil with Fibonacci Levels.
http://stockcharts.com/h-sc/ui?s=$WTIC&p=M&b=5&g=0&id=p78084205633&a=377001313&r=1416384531403&cmd=printUranium has been depressed for a long time and might be ready for a tour to the upside.
http://www.kitco.com/news/video/show/Cayman-Liberty-Forum/831/2014-11-17/Gold-To-Head-Higher-But-Theres-A-New-Metal-To-Watch---Cayman-SpeakerAluminum index. Not all metals are in downtrend.
http://stockcharts.com/h-sc/ui?s=$DJUSAL&p=W&b=5&g=0&id=p63960789798&a=328730993&r=1416768955254&cmd=printAnd now to Currencies.
Germany has done quite well since the financial Crisis and been a Locomotive on the European Train. Some key reasons that have given Germany
some advantages to other Countries.- Weak Countries around Germany has put pressure on the Value of the Euro currency and kept it relatively low. That is one of the reasons
why Germany hasn´t made too much pressure on its neighbors. The Value of the Euro would have been much higher if it only reflected Germany´s economy.
And a higher Value on the Euro would have made it hard for Germany to compete on the world marked. - Germany has been able to keep wages relative low by importing cheap labor from Eastern Europe.
- Germany has made some reforms and among the PIIGS countries it is only Ireland that have actually made reforms and made its way out of the crisis. And France is still behind.
I think we could have an interesting setup in the next Chart on Euro (Philadelphia index) with a possible Bull-flag.
http://stockcharts.com/h-sc/ui?s=$XEU&p=M&b=5&g=0&id=p07591046369&a=350647514&r=1415997681059&cmd=printDollar Index is on the rise but will soon head in to resistance and it has to overcome this resistance. Otherwise we could have a sHs pattern in the Dollar.
http://stockcharts.com/h-sc/ui?s=$USD&p=M&st=1987-01-01&en=2015-03-29&id=p76465731849&a=232898608&r=1415998329149&cmd=printThis is contrary to what everybody else see in the Currency marked at the moment and why should the Euro become stronger ?
The reason could be that some of the weak countries in southern Europe leave the Euro-Currency as Hans Werner Sinn suggests in his presentation of his just released new book: The Euro Trap.
Another key could be that the weak countries finally decide to make the hard needed reforms that's necessary to rebuild these countries economy.
In this video you can watch his presentation on his new book.
https://www.youtube.com/watch?v=tm6REM-AFTgNext chart is the Monthly Swiss Franc (Philadelphia index).
http://stockcharts.com/h-sc/ui?s=$XSF&p=M&b=5&g=0&id=p31076666761&a=284775146&r=1415999444064&cmd=printMarket breath charts.
% of stocks above 50 MA.
http://stockcharts.com/h-sc/ui?s=$SPXA50R&p=D&b=5&g=0&id=p88572352935&a=228392746&r=1416772345414&cmd=print% of stocks above 200 MA.
http://stockcharts.com/h-sc/ui?s=$SPXA200R&p=D&yr=3&mn=0&dy=0&id=p31813833893&a=228395171&r=1416772427810&cmd=printIndexes.
China seems to gain strength and enter a new uptrend. Will it give strength to Commodities ??
http://stockcharts.com/h-sc/ui?s=$SSEC&p=W&yr=7&mn=0&dy=0&id=p33804877519&a=218762234&r=1416768341366&cmd=printIndia Bombay.
http://stockcharts.com/h-sc/ui?s=$BSE&p=D&b=5&g=0&id=p72515887449&a=286300623&r=1416769435522&cmd=printGerman DAX with Fibonacci Levels.
http://stockcharts.com/h-sc/ui?s=$DAX&p=W&yr=6&mn=6&dy=0&id=p48356590008&a=298477474&r=1416769524789&cmd=printSP-500 with Fibonacci Levels.
http://stockcharts.com/h-sc/ui?s=$SPX&p=W&yr=6&mn=6&dy=0&id=p43035655412&a=297383782&r=1416769621922&cmd=printWilshire 5000.
http://stockcharts.com/h-sc/ui?s=$WLSH&p=W&b=5&g=0&id=p17178908563&a=217859758&r=1416771763316&cmd=printSomething else of interest.
Demographics.
Harry Dent has done some research on Demographics on Countries around the World. And with the use of Demographics you can predict
Spending waves in each Country. As an example Chinas spending wave made a top in 2012.
http://www.hsdent.com/uploads/DownloadDoc/general/swiw.pdfGreen energy bubble. Per Wimmer.
https://www.youtube.com/watch?v=waWYb5xGOaM
https://www.youtube.com/watch?v=-eFu8llGJg0War cycles.
1 - http://images.moneyandmarkets.com/2654/chart3s.gif
2 - http://images.moneyandmarkets.com/2654/chart2s.gif
3 - http://images.moneyandmarkets.com/2654/chart1s.gifRegards
nfø
https://www.facebook.com/pages/Teknisk-Analyse-TA-Business-cycles/168152833231786 - Weak Countries around Germany has put pressure on the Value of the Euro currency and kept it relatively low. That is one of the reasons



Hello! It looks like you're interested in this conversation, but you don't have an account yet.
Getting fed up of having to scroll through the same posts each visit? When you register for an account, you'll always come back to exactly where you were before, and choose to be notified of new replies (either via email, or push notification). You'll also be able to save bookmarks and upvote posts to show your appreciation to other community members.
With your input, this post could be even better 💗
Tilmeld Log ind